Introduction
In the high-speed digital age, IT reliability has moved from being an optional extra to a non-negotiable strategic must-have. At the same time, companies are wrestling with complex hybrid IT environments that span cloud platforms, on-prem infrastructure, and distributed networks. As a result, old-school monitoring tools are struggling to keep up, leaving IT teams up to their necks in disconnected metrics and alert fatigue.
That’s exactly where AI-powered observability comes in the new frontier of IT reliability because it turns raw data into actionable insights, predicts potential downtime, and empowers teams to make faster, more informed decisions.
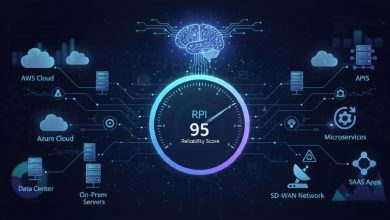
Notably, Scout-itAI is at the forefront of this transformation a cloud-native Event Intelligence Service (EIS) that’s taking the monitoring world by storm with its agentic AI, generative AI, and predictive analytics. In other words, it brings together monitoring data from across applications, infrastructure, and networks to deliver a single, easy-to-understand reliability score for business-critical services.
Monitoring vs. Observability vs. AI-Driven Observability
To begin with, traditional monitoring just asks: “Is something still up?”
Next, observability takes it up a notch: “Why isn’t it working right?” by tying together signals like logs, metrics, and traces across systems (think OpenTelemetry).
Finally, there’s AI-driven observability the next logical step where correlation and context help teams move from signals to root cause faster. This is why ideas like Observability 2.0 and CNCF have gained so much traction.
Here’s a simple way to see the shift:
| Capability | Traditional Monitoring | Observability | AI Observability / AIOps |
| Primary output | Alerts & thresholds | Context-rich signals | Decisions + recommended actions |
| Cross-domain correlation | Limited | Partial | Strong (events + dependencies) |
| Noise reduction | Manual tuning | Some | ML-driven + governance |
| Reliability impact | Hard to prove | Easier to investigate | Easier to predict & optimize |
The IT Reliability Scorecard: A Practical Guide to AI Observability & RPI Scoring
Why IT Reliability Has Become a Whole Lot Tougher
Reliability used to be all about keeping servers up. However, today it’s about keeping customer experiences fast and available across a crazy hybrid, multi-vendor delivery path.
Consequently, IT leaders run into three real-world problems:
1) Your tools are siloed — and so is your truth
You might have an APM system that’s top-notch, yet still miss a performance regression caused by an obscure DNS issue, a cloud region blip, or a third-party dependency. The reason is simple: data is scattered all over the place, and reliability becomes a debate not a measurable thing.
2) Alert fatigue hides what matters
When you’re getting slammed with alerts, inevitably, high-signal incidents get lost in the noise. That’s why noise reduction and smarter correlation really matter.
3) Business stakeholders need straight answers not tech jargon
CIOs, CDOs, and digital leaders don’t want dashboards full of tech-talk. Instead, they want clear answers:
- What’s the business impact?
- What changed?
- What’s the fastest safe fix?
- What does this mean for reliability next week?
How AI is Reshaping Observability
Artificial Intelligence (AI) and especially agentic AI and Generative AI is revolutionising observability by taking messy telemetry and turning it into predictive, actionable insight. Here’s how it plays out.
Generative AI: making sense of messy telemetry
GenAI can turn encryption-ridden, hard-to-parse telemetry into:
- Clear summaries of what’s going on
- Most likely cause” explanations
- Suggested next actions and queries to validate assumptions
- Business-language narratives for stakeholders
Agentic AI: moving from insight to action
Agentic AI adds sub-agents that can:
- Watch signals continuously
- Escalate intelligently
- Recommend and trigger safe automations
- Self-correct under governance
That said, the key is doing this without wild fluctuations or runaway automations especially in high-stakes environments. And that’s where Scout-itAI’s approach is different.
Scout-itAI: Where Reliability is More Than Just a Number
Scout-itAI is a cloud-native Event Intelligence Service (EIS) designed to make reliability understandable and improvable across infrastructure, applications, and networks. The core idea: don’t just “observe more.” Standardize reliability so teams can improve it with confidence.
1) Reliability Path Index (RPI): a reliability score people can actually use
Instead of asking every team to interpret thousands of metrics, you can give them a simple RPI reliability score (a 13-bucket scoring model built on years of industry experience) and let them focus on fixing what matters.
This is where “Democratizing Observability” becomes real in practice:
- For IT teams, a consistent model across different domains finally starts to make sense
- For execs, a clear and standardised reliability narrative they can get behind
- For everyone, from engineers to executives, a shared language around service health scoring
Want the lowdown on the model? Start by checking out the Reliability Path Index overview on Scout-itAI.
2) Predictor: Monte Carlo reliability forecasting for better decisions
Most observability platforms explain what already happened. In contrast, Scout-itAI adds predictive observability by using Monte Carlo-based simulations to forecast how changes will impact reliability so it’s not just guesswork.
Importantly, Monte Carlo techniques are widely used in reliability and incident analysis because they help teams handle uncertainty and variability. Along those lines, Google’s SRE work has pushed the idea of tying forecasting directly to reliability scoring, so teams can estimate “reliability ROI” before committing to a project.
Some practical use cases look like this:
- “If we tweak alert thresholds and fix packet loss on this path, what happens to reliability next month?”
- “Which dependency is the biggest drag on the RPI score over the last 90 days?”
- “Where’s the best place to spend money to reduce MTTR the fastest?”
3) Blender + Trender: getting ahead of problems before they become a real issue
Scout-itAI brings statistical techniques and trend analysis to detect issues sooner than users notice them. For example, it uses:
- Six Sigma analysis to study alarm/metric patterns and identify what’s really going on
- Adaptive trend tracking (like a KAMA baseline) to catch slow, steady drift you’d otherwise miss
Ultimately, this is how teams move from “we knew it was a problem” to “we prevented it from happening.”o detect issues sooner than users notice them. For example, it uses:
4) Governed, agentic automation with Promise Theory
Automation is only useful if you can trust it not to go haywire at the worst possible moment. So, Scout-itAI uses an agent-based framework with governance principles, including Promise Theory concepts, to reduce drift and lower the risk of automation hallucination. As a result, recommendations and automations are far more likely to behave as expected.
To learn more, check out the Promise Theory engine in Scout-itAI.
What does this look like day-to-day for IT and business teams?
Here’s a reliability workflow that actually works for both engineers and executives:
Step 1: Get reliability across domains on the same page
First, unify signals from existing tools (like Splunk, Dynatrace, Broadcom DX NetOps/OI, etc.) into a shared service-level view. Then, align on a reliability score (Scout-itAI).
Step 2: Cut down the noise and get to the root of the issue
Next, use AI to cluster related alerts, identify probable causes, and surface the handful of events that actually matter.
Step 3: Turn it into a business impact story
Then, instead of “latency spike in AZ2,” you get something like: “Checkout latency increased for users in Region X, likely due to path instability. Estimated conversion impact: medium. Recommended action: reroute traffic and validate DNS response times.”
Step 4: Forecast and prevent the next incident
Finally, reliability forecasting becomes a leadership tool. Because if reliability is measurable and forecastable, it becomes governable just like cost or security posture.
Scout-itAI’s “Cloud” and “Monitoring” use cases show how this plays out across hybrid environments.
The new reliability metrics leaders should care about
Most orgs track MTTD and MTTR and they should. Still, Google’s SRE team also warns that incident metrics can be tricky, so teams should be thoughtful about how they use them for decisions and trend analysis.
What AI observability adds, though, is the missing piece: service health scoring that’s consistent across domains. When you combine:
- MTTR/MTTD (speed)
- Reliability score (quality of delivery)
- Forecasted reliability (future risk)
…you end up with a reliability program that’s measurable, explainable, and improvable.
Conclusion
In 2026, reliability isn’t an IT metric, it’s a customer metric. So, the path forward isn’t “more dashboards.” Instead, it’s AI observability that connects signals, reduces noise, explains root cause, and helps teams prevent incidents.
Scout-itAI was built to meet that need for a top-to-bottom Event Intelligence Service that ditches the technical jargon and gives you plain-English answers, backed up by an RPI score and predictions you can actually work with.If you’re ready, take a look at Scout-itAI’s platform and book a demo.
Frequently Asked Questions
AI observability means applying machine learning and generative AI to logs, metrics, traces, and events — so that you can spot anomalies, identify likely causes, and guide your team toward fixes and improvements.
Observability is about seeing what your systems are doing from the signals they produce. Meanwhile, AIOps uses that data to support decisions, cut through noise, and resolve problems faster.
AI reduces unnecessary alerts, speeds up root-cause analysis, and helps you focus on what matters most. On top of that, it can automate safe fixes — so recovery is faster and less stressful.
Because each tool tells its own story — app, infra, network, cloud. Without a way to connect the dots, teams spend too much time piecing things together instead of fixing them.
A reliability score is like a report card for how well your systems are delivering. Put simply, it turns complex data into a clear signal leaders and teams can actually use.
Predictive observability uses past performance and statistical models to estimate what might go wrong (and when). As a result, you can prevent incidents instead of reacting after they hit.
It deduplicates alerts, groups related issues, filters noise, adds context, and prioritises what’s most likely to hurt you. In short, it makes the signal stand out.
Event correlation connects related symptoms across tools and systems to identify the underlying cause. That way, you can fix the real problem instead of chasing individual alerts.
Agentic AI is like having AI assistants that help diagnose issues, propose fixes, and sometimes automate actions. So, teams can resolve more — with less manual effort.
Scout-itAI unifies telemetry from apps, infra, and networks, then simplifies it into a reliability score and forecast. Consequently, you stay ahead of issues instead of constantly playing catch-up.

Tony Davis
Director of Agentic Solutions & Compliance