Product Case Study

Fortune 200 Reliability with Scout-itAI + Broadcom NetOps

Delivering Fortune 200 reliability through Scout-itAI plus Broadcom NetOps.

Short Description

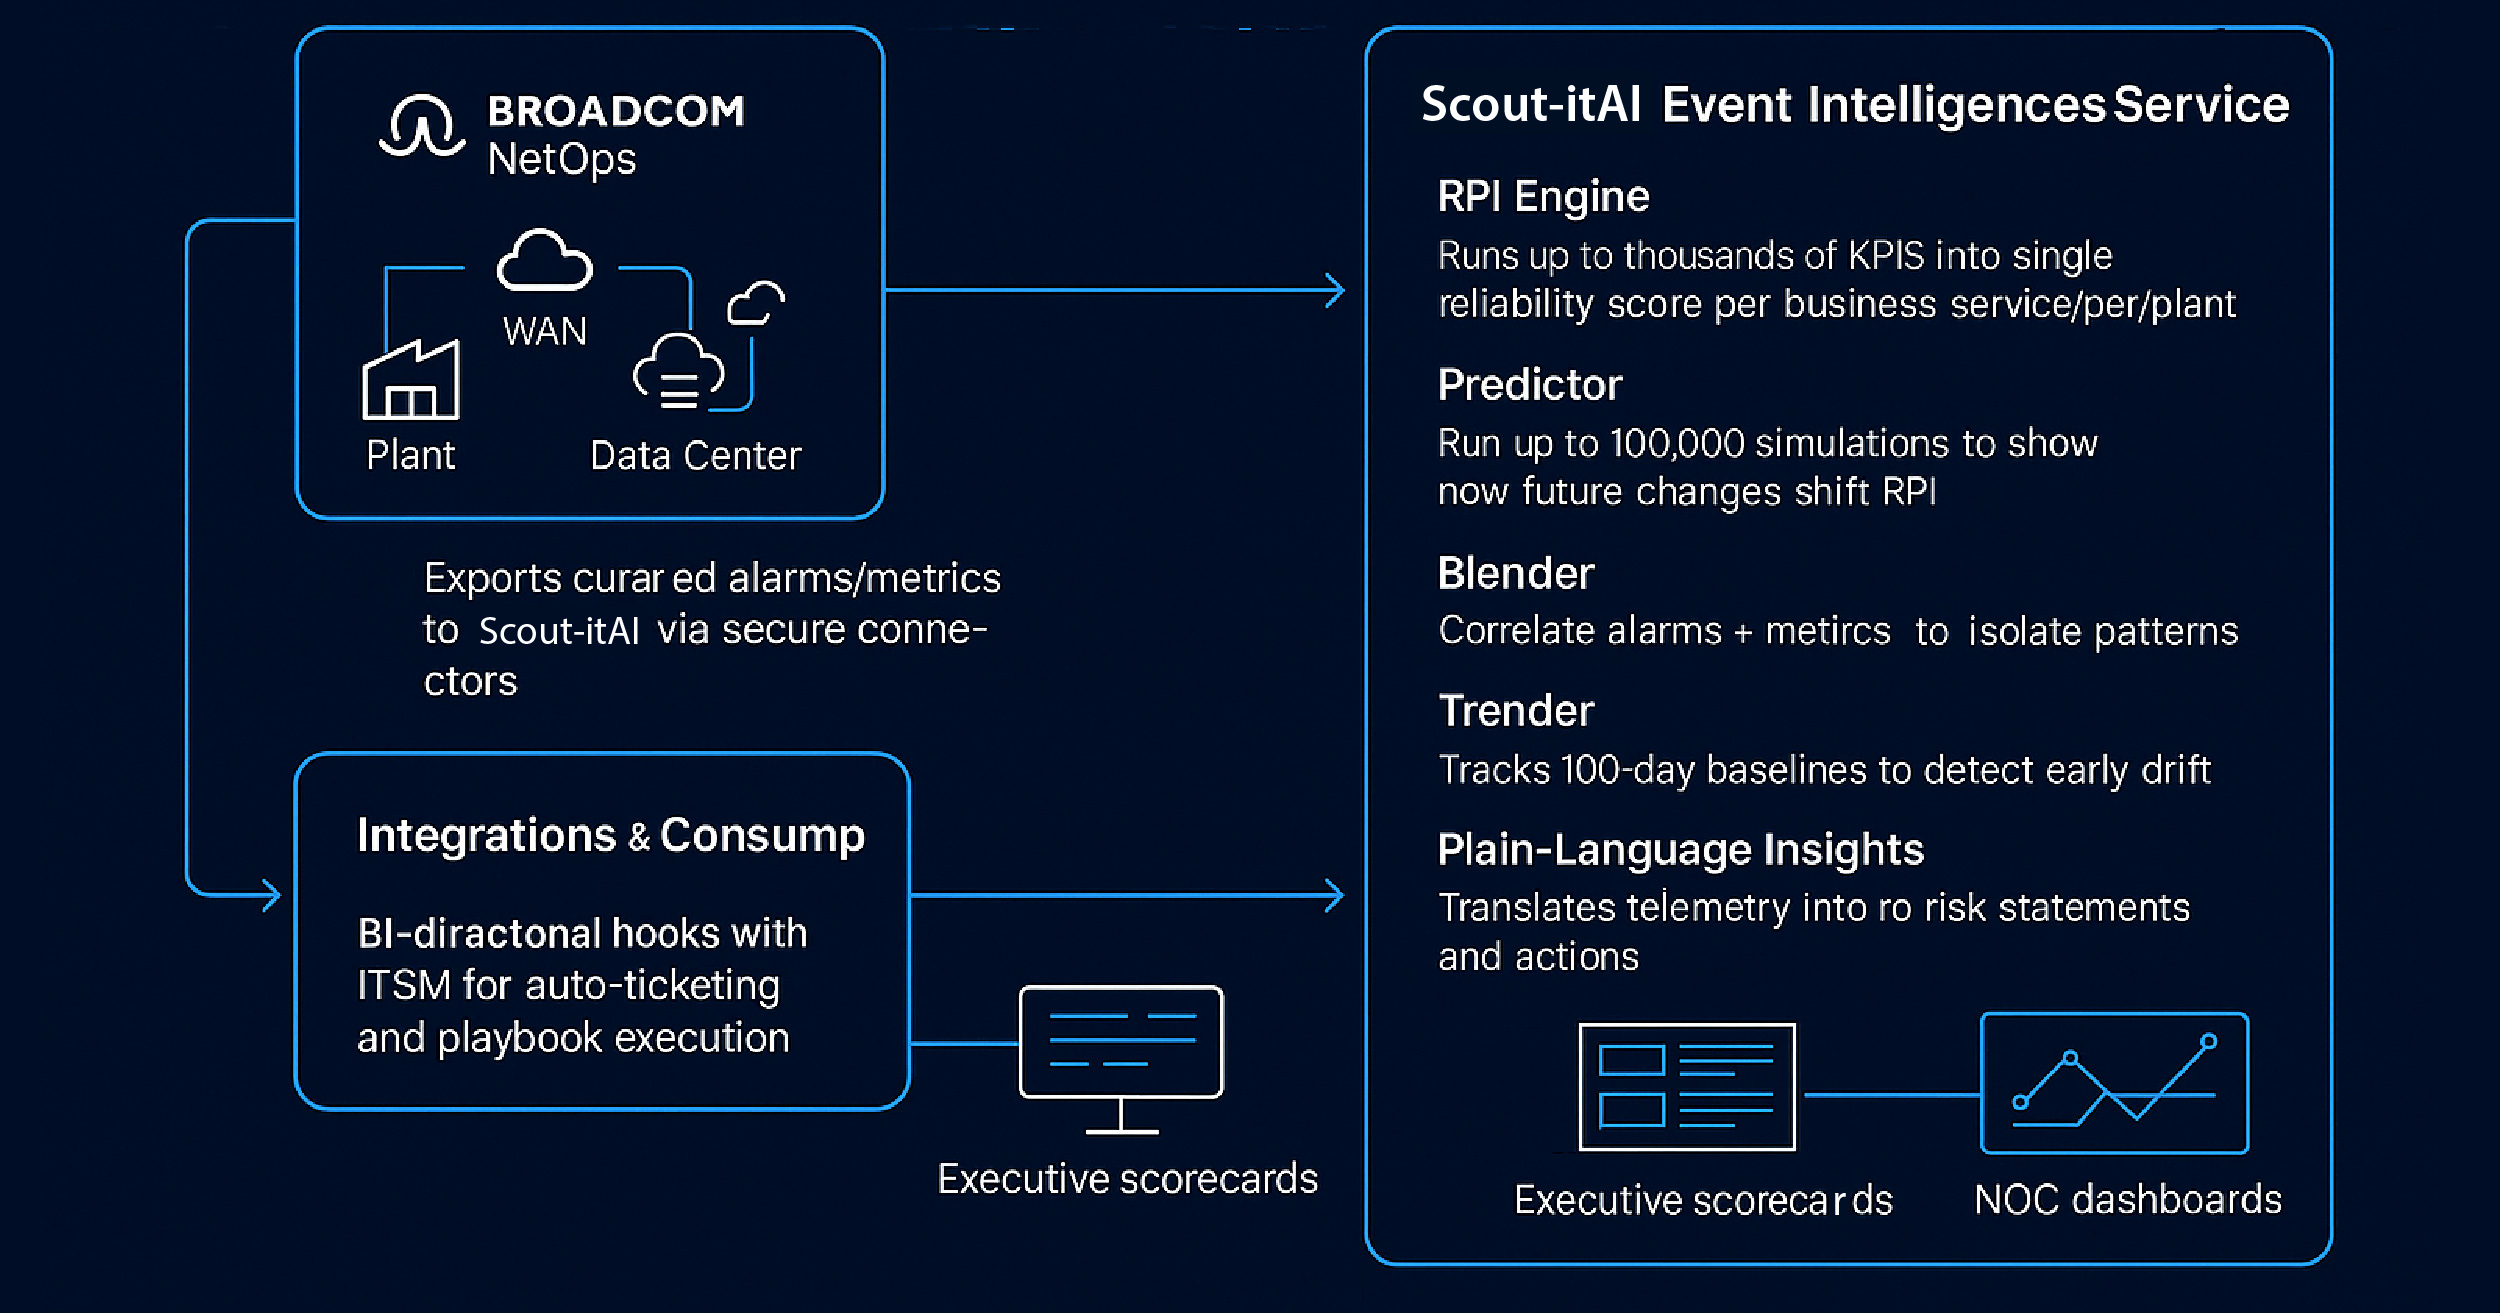
A Fortune 200 manufacturer modernized service reliability across plants, applications, and networks by pairing Scout itAI’s Event Intelligence Service (EIS) with Broadcom NetOps. Using the patented Reliability Path Index (RPI), agentic AI, and deep integrations, the team translated noisy telemetry into plain-language, executive-ready answers cutting MTTR, shrinking alert fatigue, and aligning IT with business outcomes.

Problem Statement

  • Siloed tooling across mainframe, plant networks, SD-WAN, cloud apps, and ERP created conflicting signals and slow incident triage.
  • Executives lacked a single, standardized reliability score to compare diverse services and plants.
  • NOC teams faced high alert volumes with little business context; effort-to-impact was unclear.
  • Leadership demanded forecastable reliability ROI and transparent progress—without “techy jabber.”

Architecture

Telemetry Foundation (Broadcom NetOps)
  • DX NetOps/OI ingests flow, SNMP, SD-WAN, and performance metrics from plant, WAN, and data center.
  • Exports curated alarms/metrics to Scout-itAI via secure connectors.
Dynatrace–Scout-itAI architecture diagram showing data flow to RPI 98/100 and automated runbooks
Scout-itAI Event Intelligence Service
  • RPI Engine (13 buckets) condenses thousands of KPIs into a single, standardized reliability score per business service/plant
  • Blender (Six Sigma) correlates alarms + metrics in real time to isolate performance-impacting patterns.
  • Trender (KAMA) tracks 100-day baselines to detect slow degradations and early drift.
  • Predictor (Monte Carlo) runs up to 100,000 simulations to show how changes (capacity, patching, topology) shift future RPI.
  • Agentic Workforce (orchestrator + sub-agents) automates root-cause hypotheses, escalation, and safe self-corrections with governance.
  • Plain-Language Insights translates telemetry into business risk statements and recommended actions.
Integrations & Consumption
  • Bidirectional hooks with ITSM (e.g., ServiceNow) for auto-ticketing and playbook execution.
  • Executive scorecards and service heatmaps exposed to CIO/COO; NOC dashboards for real-time action.
  • Cloud-agnostic coverage (AWS/Azure/GCP/on-prem) with up to 12 months history.

Results & Outcomes

  • MTTR ↓ 41% via AI-guided triage and automated playbooks.
  • P1/P2 incident volume ↓ 28% after Six Sigma-based noise reduction and correlation.
  • Alert fatigue ↓ ~60% by focusing operations on 13 RPI buckets tied to business impact.
  • SLA breach risk ↓ 32% as Trender exposed slow degradations before they became outages.
  • Executive alignment: Monthly RPI scorecards enabled plant-to-plant and service-to-service comparisons in one number, boosting trust and funding for reliability work.
  • Predictable planning: Monte Carlo forecasts quantified reliability ROI for network upgrades and patch windows, improving change-adoption decisions.

TCO & Operational Efficiency

  • Tool Consolidation: Leverage Broadcom NetOps as the authoritative network signal, unify with app/infrastructure telemetry inside Scout-itAI—fewer overlapping licenses and dashboards.
  • People Efficiency: Agentic automation offloads repetitive triage, freeing senior engineers for systemic fixes.
  • Incident Cost Avoidance: Fewer high-severity incidents and faster recovery reduce downtime costs on production lines.
  • SLA breach risk ↓ 32% as Trender exposed slow degradations before they became outages.
  • Cloud & Data Costs: Smart sampling and reliability-bucket focus limit data egress and storage while preserving decision-grade fidelity.
  • Adoption & Training:Plain-language insights shorten onboarding; RPI makes non-technical reviews efficient (less analyst time to prep decks).

Lessons Learned

Start with Business Services: Map plants/lines and critical apps to RPI early; don’t boil the ocean.

Govern the Agents: Define safe-action guardrails and rollback paths; measure success per action.

Baseline Before You Tune: Use KAMA-based trends for ~100 days to separate structural issues from noise.

Make It Executive-Ready: Lead with RPI and risk statements; keep metric firehoses behind the scenes.

Forecast to Fund: Use Monte Carlo deltas to justify network and capacity investments with quantified reliability ROI.

Close the Loop: Pipe plain-language recommendations into ITSM playbooks and track outcome KPIs (MTTR, change success rate, RPI lift).


Simplified Analytics Simplified Analytics
Fast Setup Fast Setup
Instant Savings Instant Savings
24x7 Support 24x7 Support