Product Feature Details

RPI-Index©

Reliability Path Index© Calculation

RPI Score
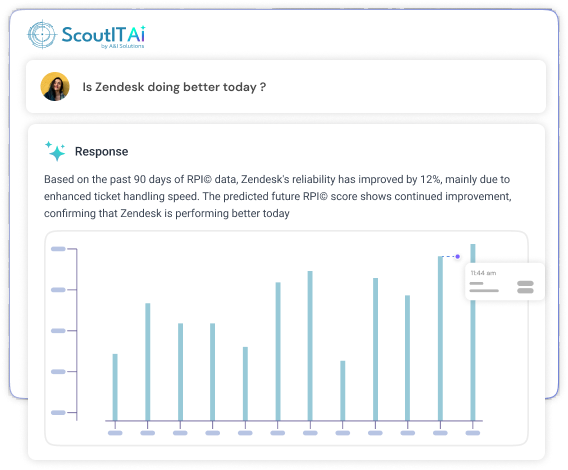
What is the RPI© Score?

The centerpiece of Scout-itAI is our patented Reliability Path Index©. Instead of simply displaying simple metrics or even traditional KPIs and trying to make sense of how your business services are being impacted, the ScoutIT-AI RPI© score shows a relative measure of how reliably each of your business services are being delivered to your customers, internal or external. This measurement when fully implemented can produce R2 values greater than .9 giving it predictive capability for both triage and continuous improvement efforts.

RPI Score Insights
How does the RPI© Score work exactly?

The RPI© historical data shows the reliability impact of each of the 14 independent variables as a ratio or percentage of the whole. Using AI, a customer is able to simply query the average reliability impact of a given variable over the last 90 days, identify the root cause of that numeric impact, implement the fix for the cause, and accurately predict the FUTURE RPI© score based on that change in production.

RPI Execution Evaluation
An Industry First

The RPI© historical data shows the reliability impact of each of the 14 independent variables as a ratio or percentage of the whole. Using AI, a customer is able to simply query the average reliability impact of a given variable over the last 90 days, identify the root cause of that numeric impact, implement the fix for the cause, and accurately predict the FUTURE RPI© score based on that change in production.

Latest Insights from Scout-itAI

Explore expert-written blogs on IT monitoring, network security, and infrastructure optimization — helping your team stay ahead with the latest insights and strategies.

Cloud Network Monitoring
Network Observability Sep. 12, 2025
Complete Guide to AI-Powered Network Monitoring

Last week, I spoke with a VP of IT Operations who summed up his frustration perfectly: “We’ve got seventeen different monitoring dashboards, and somehow we’re still blind when things go wrong.

Read blog  
Network Monitoring
Network Observability Sep. 15, 2025
Network Observability vs Traditional Monitoring: 2025 Comparison

Traditional network monitoring tells you something is wrong. Network observability tells you why it’s wrong, where the issue started, and how far it has spread.

Read blog  
Cloud Monitoring
Network Observability Sep. 17, 2025
10 Signs Your Network Monitoring Needs an Upgrade

Your network is the lifeblood of your business, but outdated tools may be silently working against you. False alarms, blind spots, and slow root-cause investigations aren’t just frustrating; they cost money, customers, and credibility.

Read blog  
Cloud Monitoring
Network Observability Sep. 22, 2025
How to Reduce Network Downtime by 80% with AI

At 4:03 p.m. on launch day, conversion rates decrease and internal communications increase. Although dashboards appear normal, the 95th percentile (p95) latency rises from 640 ms to 873 ms within 11 minutes. Such scenarios are common in network operations.

Read blog  
Network Monitoring
Network Monitoring Sep. 24, 2025
Multi-Cloud Network Monitoring Best Practices

By 2025, enterprises are no longer asking whether to use cloud computing but how extensively to adopt multi-cloud. Leveraging providers like AWS, Azure, and Google Cloud has become standard, offering flexibility, resilience, and competitiveness.

Read blog  
Network Analytics
Network Analytics Oct. 10, 2025
Real-Time Network Analytics: Implementation Guide

Modern networks don’t sit still. They span hybrid clouds, SD-WAN edges, Wi‑Fi, SaaS, and mission‑critical apps your customers touch every minute. When something blips, users feel it fast. That’s why real-time network analytics has gone from “nice to have” to must-have for IT managers and CTOs.

Read blog  

FAQs

The red color indicates that the respective application or location is not active and on the contrary green color indicates that the respective application or location is active.

After implementation, you can easily add the application you want to monitor and in about five minutes you would be able to monitor the performance of the application.

The numbers of the left side indicated the data loss percentage and the right side indicate the latency. These are used as the major KPIs of performance indicators.

Scout-itAI uses proprietary scoring formulas based on industries we have worked with. The reliability for any given service is calculated in real time to show how resilient that service is to experience.

Yes, according to your ‘number of users’ agreement with A&I.

ScoutITAi’s enterprise pack has upgrades that allow users to integrate their own monitoring data and even include it to calculate the reliability score.

Unlike traditional synthetic monitors, Scout-itAI uses both active and passive network monitoring to create synthetic traffic for any given service path. Therefore, Scout-itAI can marry network performance with application performance in real-time.

You can configure alerts by creating Alert Global Policy. Alert can be set on monitoring type Data Loss, Data Jitter, and Latency. Set caution and danger threshold for monitoring types. When threshold matched, triggered alerts can be seen on the Manage Alert screen.

Yes, since Scout-itAI utilizes synthetic monitoring, it can follow a network just like your users do.

Scout-itAI uses a synthetic or active monitoring approach rather than a legacy monitoring SNMP approach. This allows Scout-itAI to provide performance visibility into any network or web application that your users can reach.


Simplified Analytics Simplified Analytics
Fast Setup Fast Setup
Instant Savings Instant Savings
24x7 Support 24x7 Support